Markets don’t move randomly.
They appear chaotic only if you don’t know what you’re looking at.
Price leaves footprints. Every rally, every collapse, every hesitation becomes part of a collective memory shared by millions of traders and algorithms. That memory hardens into invisible walls—zones where buyers repeatedly step in, and areas where sellers consistently take control.
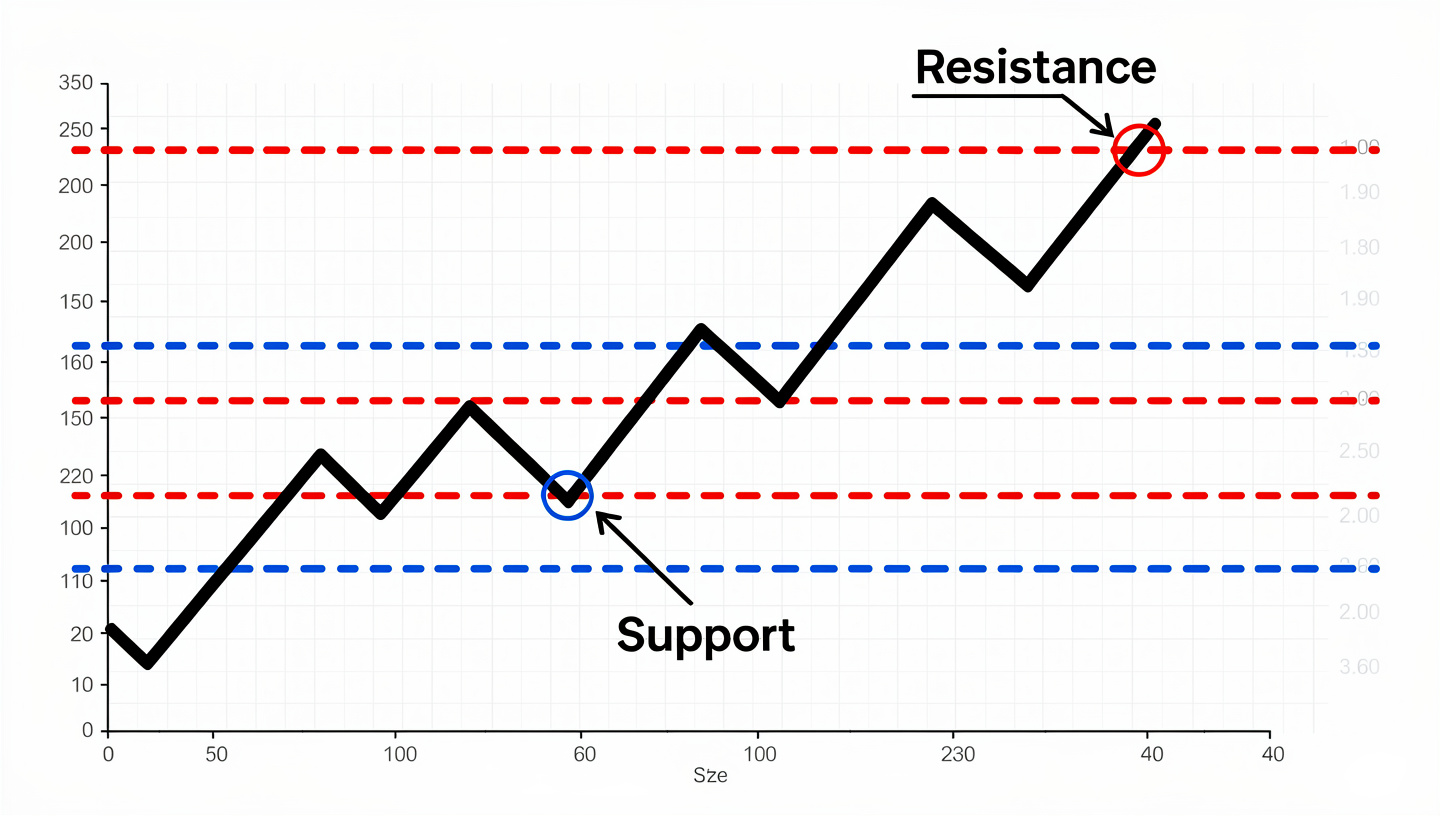
Those walls are called support and resistance.
Not indicators.
Not magic lines.
Not chart decorations.
They are the structural framework of price itself.
This article strips away the mythology and explains support and resistance in crypto with precision—how they form, how professionals use them, why beginners misinterpret them, and how you can apply them systematically in real trading environments.
No fluff. No folklore. Just market mechanics.
What Support and Resistance Actually Are
At their core:
- Support is a price zone where demand historically exceeds supply.
- Resistance is a price zone where supply historically exceeds demand.
Notice the word zone. Not line.
Price does not reverse at razor-thin levels. It reacts in areas. These areas exist because traders remember them.
If price previously crashed from $40,000, many participants will sell there again.
If price previously bounced hard from $30,000, buyers will step in again.
Markets are memory systems.
Support and resistance are memory made visible.
Why These Levels Exist in Crypto (Even More Than Traditional Markets)
Crypto exaggerates everything:
- Volatility is higher
- Leverage is widespread
- Retail participation is massive
- Liquidity shifts violently
That makes support and resistance stronger, not weaker.
Why?
Because emotional behavior is amplified.
Fear-driven capitulation creates obvious bottoms.
Euphoria-driven buying creates obvious tops.
On centralized exchanges like Binance and Coinbase, millions of limit orders cluster at similar levels. Algorithms observe those clusters. Human traders react to them. The feedback loop reinforces itself.
Support and resistance become self-fulfilling structures.
This is not psychology in the abstract. It’s order flow.
The Three Types of Support and Resistance
1. Horizontal Levels (Classic Structure)
These come from obvious swing highs and swing lows.
If price repeatedly rejects the same area, that zone becomes significant.
These are the levels beginners usually learn first—and often misuse.
Professionals don’t draw dozens of lines. They identify major inflection zones where large volume previously changed hands.
One strong level beats ten weak ones.
2. Dynamic Support and Resistance
These move with price.
Examples include:
- Moving averages
- Trendlines
- Channels
In strong trends, price often respects dynamic levels more than horizontal ones.
But here’s the key:
Dynamic levels only work when aligned with structure.
A moving average alone is noise. A moving average overlapping prior horizontal support is actionable.
Confluence creates probability.
3. Psychological Levels
Round numbers matter.
$10,000
$20,000
$50,000
Not because they’re mathematically special—but because humans anchor to them.
Large players know this.
Liquidity accumulates around these prices. Stops cluster there. Breakouts accelerate through them.
Never ignore round numbers.
They are liquidity magnets.
Support Turns Into Resistance (and Vice Versa)
This is one of the most important concepts in technical trading.
When price breaks below support, that former support often becomes resistance.
Why?
Because trapped buyers exit when price revisits their entry.
And sellers defend the same zone.
This role reversal is not theory. It’s observable in every liquid market.
Professionals wait for this flip.
Retail traders chase the initial breakout.
That difference alone explains many losing accounts.
How Institutions Actually Use These Levels
Large participants don’t buy or sell all at once.
They accumulate and distribute.
Support zones are accumulation areas.
Resistance zones are distribution areas.
Institutions build positions quietly at support, then unload them gradually near resistance.
They also engineer fake breakouts to harvest liquidity.
If you’ve ever been stopped out right before price reverses, that wasn’t bad luck. That was liquidity extraction.
Support and resistance mark where this extraction happens.
Drawing Levels Properly (Without Overcomplicating)
Most traders draw too many lines.
Here is the professional approach:
- Zoom out to higher timeframes first (daily, weekly)
- Identify only the most obvious swing highs and lows
- Mark zones, not lines
- Ignore minor intraday noise
- Look for multiple reactions at the same area
If you need 20 levels to explain price, you’re overfitting.
Three to six major zones is usually enough.
The Volume Connection
Support without volume is weak.
Resistance without volume is unreliable.
High-volume reactions validate levels.
Low-volume reactions do not.
Volume tells you whether large players are involved.
If price touches support on declining volume, expect continuation.
If price slams into support on massive volume, expect absorption and potential reversal.
Volume is the lie detector.
Breakouts vs Fakeouts
Crypto is notorious for fake breakouts.
Price pushes above resistance, retail buys aggressively, then price collapses.
Why?
Because real breakouts require:
- Strong volume expansion
- Clean closes beyond the level
- Follow-through on the next candle
Without those, you’re watching a liquidity grab.
Professionals wait for confirmation.
Retail traders buy the first green candle.
Using Support and Resistance in Real Trading
Here are practical applications.
Entry Planning
Buy near support in uptrends.
Sell near resistance in downtrends.
Never chase price in the middle of ranges.
Let price come to you.
Stop Placement
Stops belong beyond the zone, not inside it.
Inside the zone = liquidity pool.
Beyond the zone = structural invalidation.
Take Profit Targeting
Resistance zones are natural profit targets for longs.
Support zones are natural profit targets for shorts.
This alone dramatically improves risk–reward.
Trade Filtering
If price is between major support and resistance, do nothing.
No trade is a position.
Patience is a strategy.
Common Mistakes That Destroy Beginners
Treating Levels as Exact Prices
They are areas.
Always.
Ignoring Timeframe Context
A five-minute support means nothing against daily resistance.
Higher timeframe always wins.
Drawing Every Minor Bounce
Noise masquerading as structure leads to confusion.
Less is more.
Assuming Every Touch Will Reverse
Levels weaken after repeated tests.
The more price hits a zone, the more likely it breaks.
Why Support and Resistance Still Work in Algorithmic Markets
Some argue that algorithms make these concepts obsolete.
They don’t.
Algorithms are trained on historical behavior.
They respond to the same structural levels humans do—just faster.
Support and resistance persist because they are emergent properties of liquidity, not artifacts of retail psychology.
Even quantitative desks model these zones.
They never disappeared.
A Brief Word on Influence and Narrative
Public figures like Elon Musk occasionally inject volatility into crypto markets with a single post.
But even those spikes respect existing support and resistance.
News changes velocity.
Structure controls destination.
Narrative moves price between levels.
Levels determine where price stops.
Combining Support and Resistance with Other Tools
On their own, these levels are powerful.
Combined with:
- Market structure
- Volume analysis
- Trend direction
- Risk management
They become surgical.
Platforms like TradingView make identifying these zones straightforward—but tools don’t replace judgment.
You still need to think.
The Professional Mindset
Support and resistance are not about predicting.
They are about preparing.
You don’t forecast outcomes.
You define scenarios.
If price holds support → bullish continuation.
If price breaks support → bearish expansion.
You plan both.
Trading is conditional logic, not prophecy.
Final Perspective
Support and resistance are not beginner concepts.
They are foundational market mechanics.
Every advanced strategy—order blocks, supply and demand, Wyckoff, market structure—ultimately reduces to the same truth:
Price moves between areas of acceptance and rejection.
Learn to see those areas clearly, and you stop reacting emotionally. You start operating methodically.
That’s the transition from gambling to trading.
Not indicators.
Not secret strategies.
Not social media signals.
Just structure, discipline, and execution.
Master support and resistance, and you’re no longer guessing what the market might do.
You’re observing what it’s already telling you.